In International Shipping News 09/03/2017

Events like Brexit and the new US administration’s policies threaten to add insult to injury as they inject even more uncertainty into the future of global trade. Spreading protectionist stances could reverse the past several decades’ steadily easing trade barriers that have supported the growth of containerization since the 1950s.
Yet hope remains for the shipping industry. Rate levels on major East-West trades improved—dramatically in some cases—in the fourth quarter of 2016. At the tail end of peak season, Hanjin Shipping Co. filed for bankruptcy, sending shock waves through spot rate markets and exposing the flaws of the alliance system in the process.1 The bankruptcy helped create a rare seller’s market that lasted through the close of 2016.
Carriers managed to sustain those higher rate levels because of an unusually early Chinese New Year, which should buoy financial results for the fourth quarter.
Although carriers will struggle to improve their financial performance this year, they can take clear steps to shore up balance sheets in this difficult environment.
They should remain laser-focused on eliminating costs from their core shipping business. For those involved in the wave of consolidation sweeping the industry—which is just about everyone at this point—it is imperative to consider taking advantage of every opportunity to save costs through effective postmerger integration and seize this unique opportunity to rationalize the global fleet.

FINANCIALS ARE BLEAK
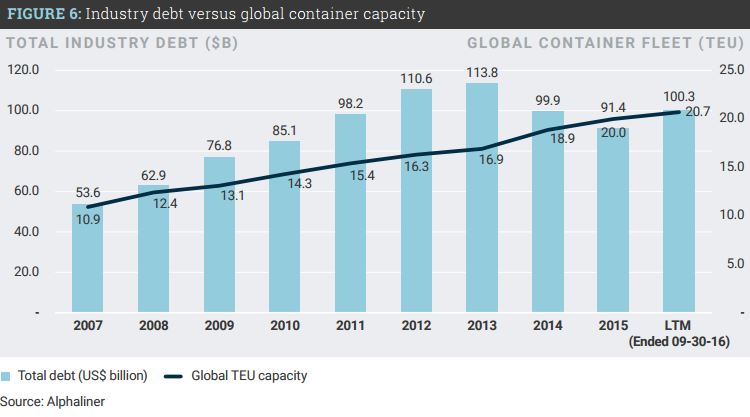
Searching for solutions to its financial woes, the shipping industry continues to seek out ways to drive down costs. Carriers have slimmed down operating expenses (OPEX) and reduced their capital expenditures (CAPEX), especially by delaying megavessel orders. The industry has slashed CAPEX by more than half in the past five years, bringing it down from $25.2 billion in 2011 to $12.4 billion in 2016.
But those efforts may not go far enough. Nearly every key financial indicator worsened from the previous year. Operational cash flow as a percentage of revenue slowed to an anemic 6% through the last-12- month period ended September 30, 2016. CAPEX still outstripped those cash flows despite the strides the industry has made.3 Meanwhile, the industry’s total debt levels, driven by borrowing from mergers-and- acquisitions (M&A) activity, have edged back up.
What’s more, earnings before interest, taxes, and depreciation (EBIT) margins turned negative in Q3 2016 for the first time in our sample period (figure 2). Those losses are not concentrated in just a few carriers. In fact, about half of our study base reported negative margin the last-12-month period (figure 3). The fact that Q3 2016 results were especially discouraging does not bode well for the 2017 calendar year, because the industry usually sees peak volumes during that period.
Those results, however, largely predate the anticipated impact of the Hanjin bankruptcy. Financial indicators had foretold a bankruptcy on the horizon. Now it’s finally happened, and it’s a big one—in fact, the biggest one since the United States Lines bankruptcy in 1986.
After struggling with mounting debt for some time, Hanjin filed for bankruptcy in South Korea in August and shortly thereafter filed Chapter 15 bankruptcy protection in New Jersey federal court. The South Korea–based shipping company commanded a market share of 2.9% of total container capacity before the filing.4 Its unraveling will likely have profound impacts on the market this year. In fact, spot rates for the eastbound transpacific trade lane, a focus of Hanjin’s network, have nearly doubled since the carrier declared bankruptcy (figure 4). This is welcome news for an ailing industry whose operators have been regularly undercutting each other on price for years. The impact on the Asia-Europe trade lane has been less noticable, but carriers have been able to keep rate levels moving slightly higher nonetheless.
As a whole, the industry’s average Altman Z-score has fallen back to a feeble 0.9, the lowest level to date (figure 5). The Z-score—a formula for predicting the likelihood of bankruptcy based on a number of metrics from a company’s public statements—of less than
1.81 suggests financial distress. For further context, we have not seen a score higher than 2.99, which is considered in the safe zone, since 2007.
Note: Spot rates on the Eastbound Transpacific trade lane have nearly doubled since Hanjin filed Source: Shanghai Container Freight Index future. But the industry can avoid another unraveling if carriers improve their financial results by maintaining higher rate levels and reducing costs throughout 2017.


CONSOLIDATION SHOULD CONTINUE APACE
The global container shipping market will likely see overcapacity as a persistent problem for the foreseeable future. Industry consolidation is only a piece of the solution, but it is a critical piece that had largely been ignored for the last decade.
Even when Hanjin—which had a negative Z-score in the last-12-month period—is removed from the sample set, the industry average edges up to only 1.0. That may signal that another bankruptcy is likely in the near future.
Fortunately, the pace of M&A activity accelerated through the end of 2016. In late October, the three largest Japanese lines—Nippon Yusen Kabushiki Kaisha (NYK), Mitsui O.S.K. Lines (MOL), and Kawasaki Kisen Kaisha (“K” Line)—announced their plans to merge in 2017.5 A few weeks later, the European Commission approved the Hapag-Lloyd-UASC merger,6 followed by Maersk’s announcement in early December that it was buying German shipping line Hamburg Süd.7 Carriers that have not been involved in a merger or acquisition are persistently rumored to be the next to do a deal. Consolidation will likely continue as the smaller carriers that lack scale to compete with the larger players struggle on their paths forward.
The recent uptick in M&A has further complicated operational alliance partnerships, which were already dynamic and recently suffering from a crisis of confidence caused by the wake of the Hanjin bankruptcy.
Last year there were four major alliances, and spring 2017 there will be three. 2M, Ocean Alliance, and THE Alliance will comprise 11 shipping operators and manage more than 70%8 of the container capacity on the Asia-to-Europe and transpacific routes in 2017.9
These shifting alliances, coupled with the wave of M&A activity, have infused more complexity and more confusion into an already turbulent market. The outlook may grow increasingly foggy for shippers and ports if any carrier in those alliances decides to merge with a partner outside its current alliance. Increasing consolidation in the market may limit shippers’ choices, but it could also widen their reach as more carriers become truly global in scale.
As the reshuffling continues, shippers should carefully reexamine their procurement strategies to ensure supplier diversity. They should make sure they’re using multiple alliances and studying carriers’ financials as a way to protect themselves from the disruption that a potential bankruptcy could cause. Executive management teams should be aware of the dynamic state of the market, because they may want to begin positioning their budgets to prepare for an era of increasing rate levels.
THE 2017 PLAYBO K FOR CARRIERS : FOCUS ON FUNDAMENTALS
Carriers that have weathered the storm have a difficult task in front of them, but the playbook remains clearly defined: focus on customer and route profitability, reduce operating costs, and rationalize the fleet. All of these actions could help support higher rate levels in 2017 and beyond. This may sound familiar to many as the story has not changed for several years but carriers continue to lag behind the curve; specifically in terms of digitization.
Focus on customer and lane profitability
Carriers should make smart and disciplined commercial decisions around customer and lane profitability. Historically, reliable year-over-year growth resulted in a market-share-driven commercial mind- set. But growth became harder to achieve in the wake of the 2008 financial crisis, and carriers were slow to adapt. They often made poor decisions around customer segment targeting and pricing.
In today’s uncertain environment, carriers have to fully understand every building block of their business. That means knowing the profitability from every customer, trade lane, and shipment. Carriers should determine the right customer profile based on volume, network, industry segment, and other important characteristics. They also have to have an understanding of the profitability of certain customers on certain trade lanes. Tying together a clear picture of costs and revenue will be a difficult but not impossible task. In fact, diving into the fundamentals and breaking down sprawling operations into smaller and more manageable blocks may make the task less daunting.
Digitization offers a possible solution. Many carriers struggle to understand real costs because they operate on fragmented, often antiquated information technology systems that are difficult to integrate.
Those outdated systems cannot accurately track real route costs, which can vary tremendously depending on market-specific operating costs. Yet the past several years have seen major advances in the tools and techniques required to capture, store, and manipulate large data sets. Building a sophisticated and centralized digital system that can pull data together and then track profitability in real time can help the executive management team make intelligent and informed decisions. Fortunately, this is not as expensive or time-consuming as it used to be.
Take full advantage of the postmerger integration process
With industry consolidation in full swing, it’s critical that carriers take full advantage of postmerger integration opportunities. Carriers must avoid the pitfalls that have plagued past integrations and make sure that value doesn’t get eroded in the process. They should retain all of the possible cost benefits of consolidation—and they should do it swiftly.
Carriers must quickly rightsize their organizations and root out inefficiencies. Merger partners with global footprints will likely have significant overlap. They might discover overlap in their back-office functions, operations centers, agency networks, terminals, inland networks, and other noncore assets around the world. Carriers should take a hard look at those duplicative assets and decide which to shed and which to keep. Plus, it’s also critical that the newly combined portfolio drive out cost and enhance service levels for customers. For example, the merger between NYK, MOL, and “K” Line will leave the new company with ownership stakes in three southern California terminals and vessel calls at seven others. If the company leaders want to reduce costs and improve customer service at this critical gateway, they should correct the fragmentation as soon as possible.
As the number of carriers drops, future entities will bring together legacy carriers with potentially clashing identities, local business rivalries, and conflicting practices. The executive management team has to make sure everyone across the new company shares the same values and goals, because the new company cannot afford productivity losses stemming from internal culture clashes. The team should perform a formal diagnosis on what the differences are, and where in the new organization they might be most pronounced. The good news is such a diagnosis can be performed relatively quickly. Arming executives with insights on similarities and differences can be invaluable to heading off culture problems during the integration process.
Rationalize the global fleet
The global industry fleet size continues to grow, but at a more muted pace. Vessel ordering programs have been slowed or stopped altogether in some cases.
Global capacity—measured in twenty-foot equivalent units (TEU)—grew from 20.0 million TEUs in 2015 to 20.7 TEUs in the last-12-month period (figure 6). Carriers should continue their efforts to trim future vessel orders to be more in line with demand forecasts.
Carriers with stronger balance sheets may be able to take advantage of a growing alternative to ordering brand-new vessels. They could pick up vessels that become available from distressed competitors and financial owners. Buying distressed assets can help carriers lower the average capital costs of their fleets and help them operate at lower costs, thereby making carriers more competitive—as long as they can fill their vessels. Being opportunistic here can pay off.
Meanwhile, vessel scrapping appears to be on the rise. According to the latest report from ship broker Braemar ACM, 35 container vessels, equating to 119,500 TEUs, were scrapped in January 2017.
There were just nine, accounting for 27,000 TEUs, by the same time in 2016. Yet those figures are not as aggressive as they look. Carriers appear to be scrapping primarily smaller vessel classes and older ships with little utility—or, put a different way, ships they have little reason not to scrap. Panamax ships, for example, account for a majority of vessels to be scrapped, totaling 16 units of 4,000 to 5,000 TEUs.10 Carriers have been reluctant to scrap larger and, typically, newer vessels that drive overcapacity—and lower rate levels—on major East-West lanes.
THE BOTTOM LINE
Carriers have to make some hard decisions in 2017. They’ve already taken steps to relieve their financial woes, including slashing CAPEX and OPEX and stepping up scrapping. They should continue to drive down costs through effective post-merger integration and fleet rationalization activities that can bring supply and demand back into balance.
Fortunately, spot rates have improved in the wake of the Hanjin bankruptcy, which carriers must maintain at the very least. The carrier community’s ability to drive rate levels higher into the transpacific contract negotiations will likely decide whether 2017 will be the turning point the industry desperately needs—or just another bad year in a growing string of losses
Source: AlixPartners