Friday, April 28, 2017

Optimism high for Asia-Europe ocean lanes after heavy month-on-month volume gains

In International Shipping News 28/04/2017

Ocean volumes on Asia-Europe trade lanes eastbound and westbound are expected to surge in the coming months, according to the latest survey results for The New APAC Forwarding Index being developed by Mike King & Associates and Logistics Trends & Insights LLC.
Higher air freight volumes are expected on key lanes to and from APAC, and the outlook for intra-Asia trade is also optimistic.
The survey results, compiled by consultants Mike King and Cathy Roberson, are the first step towards the creation of a new Index for Asia forwarding markets which will be published in the coming months. The second survey is open to anyone with insight or business linked to key trade lanes to and from APAC used by forwarders and third parties. Please click here to participate.
APAC OCEAN FORWARDING MARKETS
60% of survey respondents said ocean freight volumes to and from APAC in April were higher than March, while 54% predicted they would handle higher volumes three months from now.

Rising demand for ocean services from Europe to Asia, a trend that has led to a shortage of capacity and loading delays at European ports, saw 80% of respondents report higher volumes on the trade in April compared to March. 70% also expect volumes on the lane to be higher three months from now.
“Demand has been higher than we’d anticipated from Europe to Asia, and there has also been some disruption to liner services following blank sailings around Chinese New Year and changes to alliances,” said one respondent. “We expect capacity to be tight well into Q2.”
70% of respondents expect APAC to Europe ocean freight volumes to increase three months from now, while 66.7% forecast that volumes will rise from APAC to North America.
However, optimism for the North America – APAC trade was hard to discern. Only 28.6% of respondents saw higher volumes on the lane in April compared to March, while only 43% expect volumes to increase three months from now.
“Despite uncertainty surrounding liner Alliances leading up to April 1 and the various bedding issues we have seen including terminal congestion in China and a lack of capacity in Europe, optimism is high for the APAC ocean freight market,” said Roberson. “The Europe to APAC trade lane had the highest percentage rate of month-to-month volume gains according to respondents to our first survey. The next most dynamic lanes were APAC to Europe and APAC to North America.
“The North America to APAC liner trade reported the lowest percentage of respondents recording volume increases in April compared to March which could be the strength of the Greenback catching up with exporters.
“On most lanes the majority of respondents expect to see higher volumes over the next three months than at present, which bodes well for forwarders and lines.”

INTRA-ASIA
Intra-Asia volumes by all modes rose from March to April, according to over 70% of respondents, while almost 60% of respondents predict higher volumes on Intra-Asia trades by all modes three months from now.

“Higher air freight volumes dominate intra-Asia expectations with a large majority of survey respondents expecting gains from this transport mode,” said Roberson.
“More generally, we’ve seen manufacturing activity perk upwards in Asia and we’re seeing a global economy that is performing well, so the demand side is good. All of this is keeping intra-Asia trade humming along by all modes.”


Source: Mike King & Associates and Logistics Trends & Insights LLC.

Capesize Market to Benefit from Increased Chinese Steel Production

In Dry Bulk Market,Hellenic Shipping News 28/04/2017

The Capesize dry bulk market is bound for a renewed sense of optimism, as higher steel production in China bodes well for its long term prospects, according to shipbrokers. In its latest weekly report, Cotzias Intermodal Shipping said that “iron ore prices have been on a rollercoaster ride over the last month. Prices started the year on a very positive note, surging up to their highest price level since mid-2014. The commodity, which hit $94.86 in February, averaged $86 in the first three months. It is still a volatile market this year but the potential restart of idled Chinese iron ore capacity will cause the most uncertainty for prices in 2017 and is likely to add to general volatility for the rest of year”.
According to the shipbroker’s, Commercial Manager – Towage Division, Christopher Whitty, “it looks like we already witnessed a certain correction in prices since the commodity has been steadily falling since mid-April, to a near six-month low, primarily on the back of concerns based on fresh signs of a supply glut and ramped-up domestic production in China. Spot ore with 62 percent content in Qingdao fell 2.5 percent to $66.53 a dry ton on Monday following a volatile last week”.
Whitty added that “the commodity, which last year climbed approximately 85%, is now not only in a bear market, but has also lost around 29% in 2017. Some believe the current drop in prices has its roots in the growing inventories at Chinese ports, though recent reports say these have started to wane. Others still blame market fundamentals and the ongoing glut that has worsened due to that fresh supply coming into the markets”.
“Of course, among the reasons cited by bears is also the potential for additional supply, both from mines in China and overseas. Mainland Chinese miners boosted production 16 percent in the first three months of 2017, official data showed.
Brazils Vale, the world’s largest shipper, posted a record first-quarter output as it started exports from its $14 billion S11D complex located southeast of Sao Luis Port in Canaã dos Carajás, in southeast Pará State. The S11D complex is Vale’s largest mining project in its history and is also considered the largest mining project worldwide. Vale hauls approx. 90 mil tons of iron ore from S11D, via the PDM Terminal at Sao Luis. This output would annually require around 500 Capesize vessels loading the product, specifically from the PDM terminal”, Whitty added.
Meanwhile, according to Cotzias’ analyst, “in Australia, supply is also booming according to estimates from Rio Tinto, the second biggest producer. Around 296m tonnes of additional seaborne supply have entered the market in the last three years. The Australian giant forecasts supply growth to slow down but a combined 100m tonnes from the world’s top six producers are expected to be added to supply this year and next”.
“In the long run, it is very promising for the Capesize segment that overall steel production in China increased in 2016 and in general it is predicted to do so again this year to support infrastructure projects as Beijing tries to stimulate the economy. That can only be a good sign for Capes hauling iron ore for steel production, from Brazil and Australia to China and it is worth keeping in mind as the market for the big bulkers seems to be correcting downwards lately”, he concluded.


Nikos Roussanoglou, Hellenic Shipping News Worldwide

Growing Long-haul Arbitrage Crude Trades To Benefit VLCC Tankers

In International Shipping News 28/04/2017

The OPEC production cuts since the start of 2017 has tightened supplies of medium and heavy sour crudes, leading to a narrowing Brent-Dubai EFS. This has made long-haul crude trades from the Atlantic Basin to the Far East economically viable, resulting in a surge in flows from the North Sea as well as Americas which has in turn boosted ton-mile demand in the VLCC sector. Growing ton-mile demand has helped to halt declining rates in a sector flooded with newbuild deliveries in Q1, as seen from the chart below. VLCC rates for the benchmark AG/Japan route rebounded from w46 end-March to current levels of w65.
Rates for a Hound Point/Far East voyage climbed by $625,000 over the past two weeks to current levels of $4.925 million on the back of tighter tonnage in the region. Our data shows that at least 9 VLCCs are carrying crude from the North Sea to Asia in April, with another 4 VLCCs fixed for May loading so far. The Brent-Dubai EFS hit a seven-year low on Monday at $0.57/bbl on Monday according to Bloomberg, which will continue to incentivize more long-haul arbitrage trades. The widening contango in Brent timespreads will also encourage traders to place more barrels into Asia. Similarly, rates for a Caribs/Singapore run grew by $300,000 over the last two weeks to $4.3 million due to increased movements from the Caribbean, Brazil and the USGC to the East.
The unwinding of onshore storage in the Caribbean as reported by Bloomberg accounts for the growing outflows to Asia, with at least 10 VLCCs heading from the Caribbean to Far East in April (up by 43% m-o-m). Robust Chinese demand for low sulfur Brazilian crude has led to a surge in Brazilian exports over Q1. Brazilian crude exports to China hit 470 kb/d in Q1, up by 70% y-o-y. While the recent rally in VLCC rates seems to have come to an end, increasing ton-mile demand from such long-haul arbitrage trades should lend some support to rates. However, whether such opportunistic trades will continue to flourish depends on a potential extension of the OPEC production cuts as well as crude spreads.


Source: OFE Insights

Stepping In Time With Mainlane Container Freight Rates

In International Shipping News 28/04/2017

Spot container freight rates on the mainlane trades recorded sharp declines in 2015, before appearing to ‘bottom out’ in the middle of 2016. Rates have retained their volatility since then but in the main are still substantially above average full year 2016 levels. What have been the drivers behind this step-by-step progress in the box freight market?
A Not-So-Merry Dance

The key mainlane trades (the Far East-Europe and the Transpacific) play a crucial role in container shipping, providing deployment opportunities for the largest ship types, a major share of revenue for the leading global liner companies and accounting for a significant share of global box trade (an estimated 26% in 2016). In 2015 and into early 2016 these trade lanes were a major cause of distress for the container shipping sector, with freight rates there sliding precipitously (see graph). In Mar-16 the westbound Far East-Europe freight index stood at 13 points, down 81% from 70 points in Jan-15 whilst the eastbound Transpacific freight index stood at 34 points in Jun-16, down 63% from 91 points in Jan-15. This took place against a background of sluggish western economic growth, with peak leg Far East-Europe trade shrinking by 3% in 2015 also influenced by apparent inventory destocking. At the same time, the ongoing addition of very large boxships placed increasing pressure on the mainlanes, with 1.4m TEU of capacity on 12,000+ TEU boxships delivered in 2014-15. Benefits from falling fuel prices and lower unit costs on the new mega-ships appeared to largely be passed on to shippers whilst further pressure on rates resulted from liner companies targeting high utilisation on their newest assets.
A Better Rhythm

However, in 1H 2016, though they remained volatile, mainlane freight rates appeared to ‘bottom out’. The high-profile collapse of Hanjin in late August, whilst testament to the hitherto difficult conditions, removed some capacity from the market, and operators began to successfully engineer careful management of active tonnage. This led to gradual improvements on both key mainlanes. Following the historical low quarterly average of 25 points in Q1 16, the westbound Far East-Europe rate index improved to 55 points in Jul-16. The eastbound Transpacific index rose 111% from 34 points in Jun-16 to 71 points in Nov-16.
Keep Dancing…

In 2017 so far, mainlane freight rates have remained volatile, with a little ground lost overall. However, in general rate levels have been maintained at improved levels substantially above 2016 averages. In Q1 17, the westbound Far East-Europe rate index averaged 55, up 37% compared to full year 2016. The eastbound Transpacific index averaged 72 points, up 45% on the same basis.
Best Foot Forwards?

So, mainlane freight rates have seen dramatic ups and downs. From today’s improved levels, further progress will be hard won, with risks on the demand side and continued challenges from the delivery of new capacity. But right now, liner companies will be enjoying the music quite a bit more than in recent years.


Source: Clarkson Research Services Limited

Russia Promoting LNG as Fuel for Oil Tankers

In International Shipping News 28/04/2017

When Russia’s biggest tanker operator launches four new vessels next year, they will not just be carrying oil to northern Europe, but the hopes of the liquefied natural gas industry.
Russian maritime shipping company Sovcomflot’s Aframax ships, capable of shifting 600,000 barrels of oil through the icy waters of the Baltic Sea to the port of Rotterdam, will be the first tankers to run on LNG, World Oil reported.
That is good news for fuel supplier Royal Dutch Shell Plc and the other energy companies that have invested more than $700 billion in LNG projects over the past decade. While ships will not transform the market — Energy Aspects Ltd. estimates that LNG as a marine fuel will account for less than 2% of total demand by 2025 — Russian tankers and Mediterranean cruise liners will help ease a global glut.
“People need to find more customers for LNG,” said Michael Newman, a shipbroker at Fearnleys A/S in London. “Big mega-projects are increasingly being replaced by smaller trains and smaller volumes, such as those for use of LNG as a transport fuel.”
Since 2014, the spot price of LNG has dropped by two-thirds to $5.4 per million British thermal units as supply swelled, crude slumped and large buyers such as Japan and Korea slowed purchases. That is pushing the industry to look beyond long-term contracts with power utilities to find other sources of demand.
At the same time, stricter environmental standards are pushing ship owners to consider cleaner fuels such as LNG, which contains virtually no sulfur. The International Maritime Organization will from 2020 impose a sulfur cap of 0.5% on marine fuel, down from the current global limit of 3.5%.
Against that favorable backdrop, the number of LNG-fueled ships will more than double to 200 by 2020 from 77 last year and just five in 2005, according to London-based Energy Aspects.


Source: Financial Tribune

Oil Tankers To Cruise-Ships Fueled By LNG Offer Hope On Gas Glut

In International Shipping News 27/04/2017

When Russia’s biggest tanker operator launches four new vessels next year, they won’t just be carrying oil to northern Europe but the hopes of the liquefied natural gas industry.
Sovcomflot’s Aframax ships, capable of shifting 600,000 barrels of oil through the icy waters of the Baltic Sea to the port of Rotterdam, will be the first tankers run on LNG.
That’s good news for fuel supplier Royal Dutch Shell Plc and the other energy companies that have invested more than $700 billion in LNG projects over the past decade. While ships won’t transform the market — Energy Aspects Ltd. estimates that LNG as a marine fuel will account for less than 2 percent of total demand by 2025 — Russian tankers and Mediterranean cruise liners will help ease a global glut.
“People need to find more customers for LNG,” said Michael Newman, a shipbroker at Fearnleys A/S in London. “Big mega-projects are increasingly being replaced by smaller trains and smaller volumes, such as those for use of LNG as a transport fuel.”
Since 2014, the spot price of LNG has dropped by two-thirds to $5.4 per million British thermal units as supply swelled, crude slumped and large buyers such as Japan and Korea slowed purchases. That’s pushing the industry to look beyond long-term contracts with power utilities to find other sources of demand.
At the same time, stricter environmental standards are pushing shipowners to consider cleaner fuels such as LNG, which contains virtually no sulfur. The International Maritime Organization will from 2020 impose a sulfur cap of 0.5 percent on marine fuel, down from the current global limit of 3.5 percent.
Against that favorable backdrop, the number of LNG-fueled ships will more than double to 200 by 2020 from 77 last year and just five in 2005, according to London-based Energy Aspects.
That will boost LNG bunkering demand, excluding fuel burned by LNG carriers, to 1 million tons in three years and as much as 5 million to 7 million tons by 2025, Energy Aspects said. Total LNG demand is forecast to rise to 364 million tons in 2025, from 260 million tons last year, according to Bloomberg New Energy Finance.
Apart from the Sovcomflot contract, Shell will also supply fuel to the world’s first LNG-powered cruise ships, which will be operated by Carnival Corp. in northwest Europe and the Mediterranean from 2019.
That will come six years after the Viking Grace — operating between Turku in Finland and Stockholm in Sweden — became the first large passenger ship to use LNG in January 2013.
Cruise Option
Carnival, which has a fleet of 107 ships, has seven vessels on order that will run on LNG.
“When our ships come along, they will be some of the biggest consumers in the maritime sector” of LNG fuel, Tom Strang, senior vice-president maritime affairs at Carnival, said in an April 6 phone interview. “We are confident that there is going to be plenty of LNG. The question is, is there LNG where we need it?’’
The infrastructure to support the use of LNG in the shipping industry is expanding, with major European ports required to have bunkering for the fuel by 2025, the International Gas Union said in a report this month.
“Ports are also largely indicating the willingness to move quickly to support demand, once it begins to strengthen,” the gas lobby group said.
The Gate terminal in Rotterdam has added facilities for loading smaller vessels and bunkering operations. Shell, the terminal’s first customer, will introduce a dedicated bunkering vessel this summer, according to Stefaan Adriaens, commercial manager at Gate.
“We see an uptick in well-founded inquiries for using this jetty,” said Adriaens. The facility has attracted Skangas as its second client, he said.
Total SA agreed this month to buy LNG from Pavillion Energy Pte for onward sale to ships in the port of Singapore, one of the world’s biggest. The French oil giant wants to supply 1 million tons of LNG annually to fuel ships by 2025.
“Developing a competitive worldwide LNG bunkering network will be key for the industry,” Total Chief Executive Officer Patrick Pouyanne said in a statement on April 4.


Source: Bloomberg

How Can Climbing Bulker Earnings Be Put Into Context?

In Dry Bulk Market,International Shipping News 27/04/2017

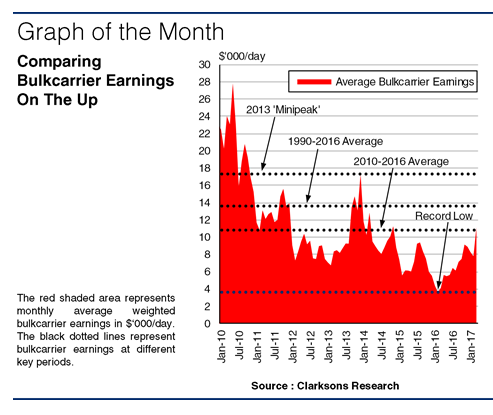
In March 2016, Commodity Countdown assessed the dry bulk market at rock bottom, as average bulker earnings hit record lows. In the thirteen months since, improved demand trends and slow fleet growth have driven a firm rise in average bulker earnings. However, while the bulker earnings environment has clearly improved in recent months, how do current levels compare historically?
Hitting Rock Bottom
By 1H 2016, the build-up of oversupply over a number of years had exerted significant pressure on bulker market conditions. Average bulkcarrier earnings fell to a record low of $3,636/day in February 2016, 73% below average bulkcarrier earnings in 1990-2016 and below typical operating cost levels. While market conditions improved tentatively in the months following February 2016, earnings in January to June 2016 still only averaged a historically depressed $4,807/day.

A Notable Climb
Bulkcarrier earnings then went on to record a distinct rise in 2H 2016 and early 2017. This was partly driven by Chinese seaborne dry bulk imports, which rose 6% y-o-y in 2H 2016 towards a record 1.6 billion tonnes in the full year, reflecting the country’s recovering steel output and the impact of Beijing’s domestic mining policies. On the supply side, strong demolition in 1H 2016 and continued delivery deferrals helped to stem the pace of bulker fleet growth to a sixteen year low of 2.2% in the full year. Overall, the improving fundamentals in the bulker sector were sufficient to see average earnings rise to $11,133/day in March 2017.
Overshadowed By Past Peaks
So, how does this compare to average bulkcarrier earnings in recent years? A quick glance at the graph might suggest that earnings in the sector remain relatively subdued compared to recent heights, even when excluding the boom years of 2004-08 when earnings reached a historical high of $65,173/day in May 2008. Indeed, bulkcarrier earnings in March 2017 were still 36% below the ‘minipeak’ of $17,314/day recorded in October 2013.
Standing Up To The Average
However, there is also a more positive context. Bulkcarrier earnings have risen notably, and with the market gaining momentum in recent months, average earnings in March reached a two year high. More tellingly, since having hit rock bottom, bulkcarrier earnings in March 2017 were already 75% of the way back towards the long term historical average of $13,576/day set between 1990 and 2016. Moreover, average bulker earnings in March actually exceeded the $10,765/day average for the post financial downturn period of 2010 to 2016.
So, bulker earnings have picked up since hitting rock bottom in February 2016, in line with improved fundamentals. Although bulker earnings remain far from robust and below recent peaks, they have recently returned to levels closer to longer term historical averages. Overall, while the recent improvement in the bulkcarrier market will no doubt have been welcomed by many owners, there are still a variety of contexts in which market performance can be viewed.


Source: Clarkson Research Services Limited

Dry Bulk Shipping: As the BDI moves higher, demolition activity weakens

In Dry Bulk Market,International Shipping News 26/04/2017

Demand

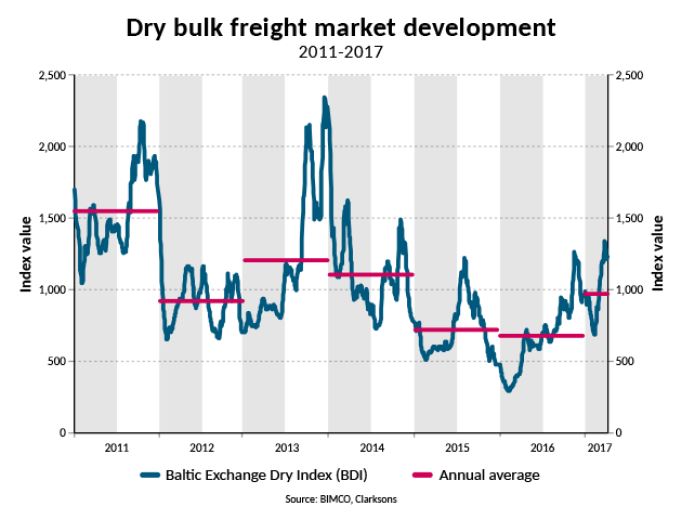
What a rebound. After the Baltic Dry Index (BDI) had its seasonal weakness around the Chinese New Year in early February, stronger-than-expected demand came from across the board and lifted freight rates. This brought earnings into profitable levels for a couple of days, as the BDI passed 1,282 on 27 March 2017.
If earnings are at profitable levels now, how come BIMCO’s Road to Recovery keeps mentioning 2018 and 2019? That’s because it focuses on full year profits for all dry bulk segments. That would require a full year where the average BDI is above 1,280. Last time we had that was in 2011. Note that the BDI average for Q1-2017 was 945. BIMCO sees the current developments as a ‘false dawn’ and reiterate expectations for 2017 as being a loss-making year for the industry as such.
As expected we had the seasonal decline in Q1-2017, but a softer landing was provided for as China’s combined imports of iron ore, coal and soybeans went up by 36.5 million tonnes (19%). The grains shipping market seems to go from strength to strength, with soya supporting the Atlantic market. This support is set to continue, as major soya exporters like Brazil and Argentina normally increase exports in Q2.
Thermal coal imports into China are also bolstering demand. Despite the suspension of the maximum-of-276-working-days-per-year policy, domestic production could not keep up with demand during the winter season. Short coal trips into China from Australia and Indonesia make the Pacific market busy. Even though the winter is over, the suspension of the 276-working-days limitation remains in place. As always, the iron ore exports from Brazil to China provide support that lifts the capesize market, despite the 35 valemax ships taking their share of the market.
Freight rates from Tubarão in Brazil to Qingdao in China went above USD 16 per tonne by mid-March as fixtures and volumes were unseasonably high. As many as 14 fixtures from Brazil to China carrying iron ore were done in one week. That was the highest number on record since the start of 2015, according to Commodore Research.

Supply

January had more dry bulk capacity demolished than February and March combined. As the BDI moved higher, demolition activity weakened. Higher demolition prices that often follow in the wake of higher freight rates do not sufficiently tempt shipowners to sell for demolition. They either keep trading the ships themselves or sell them off in the second-hand market as asset values have climbed too.
BIMCO’s Road to Recovery, encourages shipowners to make fleet expansions via the second-hand market – and that we have certainly got. But it also builds on 0% total fleet growth, something which can only come around via more demolition. A ‘false dawn’ means that fundamental market balance improvements are happening much slower, if at all as the supply side is still growing almost as much as the poor demand growth rate.
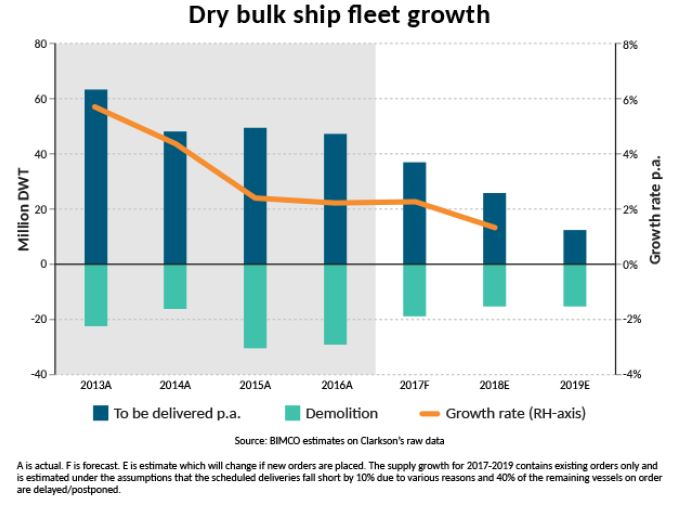
In nominal DWT terms, the total dry bulk fleet has already grown by 1.5% or 11.7 million DWT in 2017. As the BDI moves higher, demolition activity gets weaker. And the BDI has certainly moved higher during February and March. The subsequent slowdown in demolition activity means that just 4 million DWT has been removed from the fleet so far in 2017. In comparison, 14 million DWT was demolished during Q1-2016.
It seems clear that the supply side is not assisting the “Road to Recovery”, which projects an annual fleet growth rate of 0%. BIMCO estimates that the supply side will grow by 2.3% for the full year, as newbuild deliveries will slow down and demolition is expected to pick up. Despite the lack of short-term comfort, relief may be found in the absence of newbuild orders since the start of 2016.
The record low ordering activity has continued into 2017, as orders have surfaced for only five ultramax ships, each of 63,000 DWT. This positive development has brought the total order book down to 69.5 million DWT all-inclusive – a level last seen at the end of 2004. Another continuing trend is that of owners expanding their fleets in the second-hand market. 2017 has already surpassed last year’s monthly average of 56 second-hand sales, as Q1-2017 saw 192 deals sealed. Anecdotal evidence of owners not spending much time, if any, on pre-purchase inspections, as they fear the deal could fail, is a sign of improved sentiment across the dry bulk market. The price for a 2010-built capesize and panamax ships has gone up by around 40% since 1 January 2017 according to VesselsValue as per 10 April 2017.

Outlook

With powerful sentiment in the market being felt and heard, it’s hard not to get carried away. You can almost feel the fear of missing out on the next super cycle as owners’ rush to the second-hand market to expand their fleets. Such strong growing interest has seen rising asset values. In turn, this also means existing ships are no longer priced significantly below newbuild ones. What it could also mean is a return to the shipyards for some of the owners who did not get the ships they were looking for in the second-hand market. So far, we have not seen a flood of new orders, but the shipyard industry certainly stands ready to take owners’ new orders.
Should such a flood of new orders come around, it will kill the ongoing recovery of freight market earnings. A lot of shipyards have a low order cover, and idle capacity to build. Add tempting leasing deals or other fully financed offers to that, and you may see orders coming in large numbers. But bear in mind, as BIMCO has cautioned earlier, making use of shipyard capacity to produce more new ships remains the most potent threat to the sustainability of the shipping market.
For the coming months, April to June, BIMCO expects the demand in the freight market to go higher. Iron ore and soybeans will grow the most, while coarse grains are set to be in lower demand – driven down by low Brazilian exports. For the supply side of the market, BIMCO expects some steam to come off. We have seen 16 million DWT being delivered in less than three months, out of a total expected amount of 37 million DWT. In total this will support the freight market. Having said that, the strong lift of freight rates in Q1 may have been a ‘false dawn’. In conclusion, the freight rates are expected to slide back to a lower level again. China has announced a ban on imports of North Korean coal until the end of 2017. China imported 22 million tonnes of anthracite coal from North Korea in 2016 and will need to source this from elsewhere if the ban is fully enforced. If the 22 million tonnes are sourced from seaborne suppliers, it will benefit the demand in the dry bulk shipping industry significantly.


Source: Peter Sand, Chief Shipping Analyst; BIMCO

Capesize Index Still in Correction Mode

In Dry Bulk Market,International Shipping News 26/04/2017

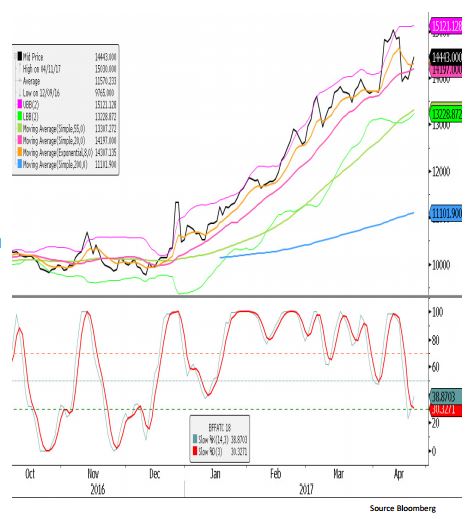
Capesize Index

Support – 12,345, 9,468, 6,570
Resistance – 14,000, 15,301, 19,602,
The weekly Capesize index remains in a corrective phase having rejected the upper range resistance 5 weeks ago. Recent corrective phases in the index have lasted between 5 – 6 weeks. We are currently on week 5, and approaching the first of the technical supports at US$ 12,345, with secondary support at US$ 9468. Technical buyers would need to see bullish rejection candles from the current support levels before looking to enter longs at these levels.

For technical seller looking for fresh entry in to the market, any upside price action that failed between us$ 14,000 and US$ 15,300 would be regarded as technically bearish going forward. The index remains technically bullish, market bulls should be on the lookout for any upward price moves that are accompanied by a weekly volume increase, as this usually confirms the start of the next upward move.

Capesize Q3 17

Daily Support – 14,210, 13,770, 13,083
Resistance – 15,492, 16,753, 16,600
Support has held in the Q3 Capesize futures and the stochastic has dropped from overbought, and is now oversold. Technically the bullish trend remains in place as the current support levels have held, an oversold stochastic lends weight to the support level at this point. Although the trend is bullish, we do have concerns regarding the depth of the recent corrective move compared to other recent market pullbacks.

Any failure to make a new high would confirm we are entering a corrective phase and current support levels are likely to be tested, and potentially broken. Technically still bullish, caution on fresh long entries from recent support levels due to the aggressive pullback.

Capesize Cal 18 Daily

Support – 13,919 13,660, 13,459
Resistance – 15,008, 15,307, 16,535 Technical support remains in place and the stochastic has moved into an oversold area. The momentum pullback has been greater than that of price, this can be vied in two ways, to some it is known as a hidden divergence, and to others it is a known as a bull trap. The fact that momentum is weakening faster than price does lend weight to support; however the weakening momentum does suggest that we could be soon looking to enter a corrective phase and fresh market longs need to be cautious here.

Failure to make fresh highs would be technically bearish, and suggest that current support levels could be broken. Any fresh high is technically bullish, however Bull traps (hidden divergences to some) usually result in a bearish divergence, and this is why we believe fresh longs need to be cautious. Note: corrective, not a bear trend as the index remains in bullish territory.

Capesize Q3 v Cal 18

Daily Support – 377, 238, (-47)
Resistance – 1,244, 1,383, 1,637
The technical footprint to the Q3 v Cal 18 futures spread is very similar to that of Cal 18 futures. An aggressive technical pullback has held at key support levels keeping the bullish trend intact. However the momentum pullback has created the hidden divergence/ bull trap that signals a weakening trend, and often end in bearish divergences if fresh highs are achieved. Technically a bull trend, market longs should now be cautious. Failure to make a new high will put current support levels under pressure. Fresh highs should result in a bearish divergence, suggesting a corrective phase could soon be upon us.

Source: Freight Investor Services (FIS)

Sunday, April 9, 2017

Baltic Capesize Index – playing from a position of strength

In Dry Bulk Market,International Shipping News 10/04/2017

With the Baltic Capesize 5TC index reaching its highest level since July 2015 and approaching long term upper range resistance, the question to be asked is are we about to break out into genuine trending conditions? The number of Capesize vessels in service is as great as it has ever been at 1,676 vessels. However, this supply is matched by iron ore exports from Australia which have increased from 20m tonnes a month in 2009 to over 70m tonnes a month by late 2016.
At the same time vessel deletions have averaged around a 5.14% increase per quarter for the last eight quarters, suggesting that owners are continuing to rebalance their fleets. Other positives for the Capesize market come in the form of the order book as a percentage of DWT. At 11.26% this is as low as it has ever been and is matched by the number of vessels under construction. At 47, this is the lowest level since March 2014 and close to the recent historical lows achieved in May 2014, which were at the time at an eight year low of 38.
The Capesize model is starting to balance out, new builds are still exceeding deletions, but that spread is narrowing, and getting ever closer to equilibrium. Although healthy, the Capesize sector is still very vulnerable to even a minor slowdown in Chinese steel production. Domestic coking coal prices in China continue to remain steady as does the domestic scrap price (- 2%), meanwhile the Chinese domestic hot rolled steel sheet spot price has dropped an average of 12.23% since February 21. Iron ore has replicated this, dropping 14% in the same period.
The resilience of scrap and the domestic coking coal levels has resulted in steel mill profit margins dropping from US$80/tonne to below US$10/tonne. The driving force behind the lower domestic steel price will be Rebar and HRC inventories, as these are at their highest levels for two years. The inventory build has been aggressive, but it has also been seasonal and can be expected to draw down over the coming months, easing some pressure on steel margins in the near term. For the Capesize index, the inventory build-up has been a key factor in recent months.
The aggressive build-up has maintained a healthy demand for iron ore and produced stronger freight rates. However iron ore imports have a tendency to decline between May and June when taken on a three to five year average, whereas Capesize rates tend to be fairly stable. This would suggest that rates may be ready for a corrective phase, setting the market up for a more bullish trend further down the line. The upward swing in the Capesize Index has now been in play for seven weeks. In recent years it has had a tendency to enter a corrective phase between week seven and week nine.
Weakening profit margins at the steel mills in China would support this in the near term. However a more balanced freight complex has reason to cheer, the corrective phase this year will be at substantially higher levels than of recent years. This bodes well for the longer term health of the market, when iron ore imports into China pick up in the second half of the year, the Capesize Index should be playing from a position of strength.


Source: Freight Investor Services (FIS)

What’s Lying Beneath The Surface?

In International Shipping News 10/04/2017

The fundamental lying beneath the shipping industry is cargo and its journey, and in many cases the cargoes are the world’s key commodities. In 2014, prices across a range of commodities took a sharp dive, but over the last year or so they’ve started to improve again. So, what do the trends in the prices of the commodities underlying the shipping markets tell us about the shape of things today?
Oiling The Wheels?
Most followers of commodities will be aware of the oil price downturn, with the price of Brent crude falling from an average of $112/bbl in June 2014 to reach a low of $32/bbl in February 2016. However, it has since improved, to an average of $52/bbl in March 2017, with the key driver the implementation of oil output cuts by major producers. Despite this recent price rise, in this case the underlying commodity price trend does not appear to be supportive for shipping, with seaborne crude oil trade growth subsequently slowing, having risen by an average of 3.9% p.a. in 2015-16, and tanker markets easing back. On the other hand, rising oil prices might start to help support an improved offshore project sanctioning environment, though the stimulation of increased shale production in the US poses a risk to its seaborne imports.

Bulk Bounce
On the dry bulk side, the iron ore price fell from $155/t in February 2013 to reach a low of $40/t in December 2015 but has since recovered robustly to an average of $87/t in March 2017. Meanwhile, the coal price fell from $123/t in September 2011 to a low of $50/t in January 2016 but has since improved firmly to an average of $81/t in March 2017. In China government policies and domestic output cuts drove shipments of ore (up 7%) and coal (up 20%) in 2016, helping to support international prices. Demand growth has continued in the same vein in 2017, with ore and coal imports up 13% and 48% y-o-y respectively in the first two months. Average Capesize spot earnings recently hit $20,000/day, and some industry players have appeared cautiously optimistic about the possibility of better markets.
Spending Power?
What does all this mean for the third main volume sector, container shipping? Well, in this case, the previous downward pressure on commodity prices had been felt in the form of pressure on imports into commodity exporting developing economies faced with reduced income and spending power. This had a clear negative impact on volumes into Latin America, Africa and eventually even the Middle East; overall north-south volume growth fell below 1% in 2016. Although it’s early days yet, the recovery in commodity prices should suggest a gradual improvement even if the benefits lag commodity pricing, and the positive impact might not be evenly paced across the regions.
From The Bottom Up
So, it appears that commodity prices have now departed the bottom of the cycle. Alongside the impression of a generally firmer background, inspection of the underlying drivers suggests a mixture of messages for shipping, less beneficial in some instances, but in many ways more positive for volumes. As ever, it’s interesting to take a look at what lies beneath…


Source: Clarksons

Dry Bulk Ships’ Prices Heat Up on Increased Demand

In Hellenic Shipping News 10/04/2017

A lack of availability, as a result of a reduced life-cycle as well, has prompted dry bulk ships’ price increases as of late. According to a recent report from shipbroker Intermodal, “the dry bulk market has undoubtedly rebounded since the same period last year and currently enjoys healthier freight rates. The positive reversal in earnings that showed its first signs during the end of last year has today become a reality that has led asset prices into an impressive rally during the first quarter of 2017. It is no wonder that a big number of shipping companies are steadily differentiating from more reserved strategies followed during the historical lows of 2016 and currently revisit the idea of investing in the secondhand market with additional vessels or to renew their fleet altogether”.
“In the meantime it is clear that the average life cycle of a Bulk Carrier has decreased. The majority of purchase enquires in the Dry sector concerns vessels from prompt resale up to maximum 15 years of age, in contrast to 2013 when purchase enquiries were mainly for vessels of around 20 years old and 2010 when 25 year old vessels were more popular. A shorter vessel life cycle combined with increased purchase appetite, luck of ample sale candidates along and firmer demolition prices have caused a “boom” in asset prices of both modern and older tonnages in a rather short period of time. It is no wonder that voices raising concern that current asset prices might be inflated are getting louder. But are these concerns excused?”, wondered Intermodal’s SnP broker, Mr. Konstantinos Kontomichis.
According to Kontomichis, “it is clear that a 10-year old Japanese Supramax vessel, valued at around $10.0m according to the latest sale- is still very cheap compared to oldest sales during times when the index was at the same levels and the orderbook for the size was substantially higher. The following sales further support the argument that prices today are higher when compared to last November but certainly not inflated at all when compared to previous years. The M/V Admiral Schmidt (55,000 dwt, blt 07, Japan) was sold at $9.8m in early March 2017. In September 2014 the ex-M/V Sea Lily (52,000 dwt, blt 04, Japan) was sold at $15.7m. In May 2013 the ex-M/V Ultra Paguera (53,600 dwt, blt 03, Japan) exchanged hands for $14.8m. Finally, in July 2012 the ex- M/V Vega Eternity (52,400 dwt, blt 02, Japan) was sold for $16.8 million”, he noted.
“To sum up, it seems that the improvement in today’s prices is not the result of a market bubble that has led to inflated prices but merely a delayed correction, which has shocked perspective buyers only because it has taken place in such a short period of time. More importantly, looking into previous years, it seems that there is more room for further correction and we will most probably witness additional price increases sooner rather than later”, Kontomichis concluded.
In the S&P market this week, Intermodal noted that “SnP activity remained firm last week, with a number of sales taking place across all of the conventional sectors, while on the dry bulk side Buyers focused on all sizes except Capes, probably a bit disheartened by the particularly high premiums they now need to pay compared to a couple of months ago. On the tanker side we had the sale of the “MARE CARIBBEAN” (46,718dwt-blt 04, S. Korea), which was sold to U.K Based owner, Union Maritime, for a price in the region of $11.4m. On the dry bulker side, we had the sale of the “KMTC CHALLENGE” (52,026dwt-blt 02, S. Korea), which was sold to Greek buyers, for a price in the region of $7.0 million”, the shipbroker concluded.

Nikos Roussanoglou, Hellenic Shipping News Worldwide