In Dry Bulk Market,International Shipping News 26/04/2017

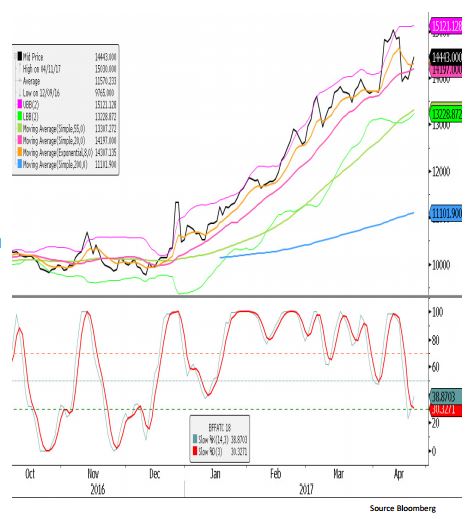
Capesize Index
Support – 12,345, 9,468, 6,570
Resistance – 14,000, 15,301, 19,602,
The weekly Capesize index remains in a corrective phase having rejected the upper range resistance 5 weeks ago. Recent corrective phases in the index have lasted between 5 – 6 weeks. We are currently on week 5, and approaching the first of the technical supports at US$ 12,345, with secondary support at US$ 9468. Technical buyers would need to see bullish rejection candles from the current support levels before looking to enter longs at these levels.
For technical seller looking for fresh entry in to the market, any upside price action that failed between us$ 14,000 and US$ 15,300 would be regarded as technically bearish going forward. The index remains technically bullish, market bulls should be on the lookout for any upward price moves that are accompanied by a weekly volume increase, as this usually confirms the start of the next upward move.

Capesize Q3 17
Daily Support – 14,210, 13,770, 13,083
Resistance – 15,492, 16,753, 16,600
Support has held in the Q3 Capesize futures and the stochastic has dropped from overbought, and is now oversold. Technically the bullish trend remains in place as the current support levels have held, an oversold stochastic lends weight to the support level at this point. Although the trend is bullish, we do have concerns regarding the depth of the recent corrective move compared to other recent market pullbacks.
Any failure to make a new high would confirm we are entering a corrective phase and current support levels are likely to be tested, and potentially broken. Technically still bullish, caution on fresh long entries from recent support levels due to the aggressive pullback.

Capesize Cal 18 Daily
Support – 13,919 13,660, 13,459
Resistance – 15,008, 15,307, 16,535 Technical support remains in place and the stochastic has moved into an oversold area. The momentum pullback has been greater than that of price, this can be vied in two ways, to some it is known as a hidden divergence, and to others it is a known as a bull trap. The fact that momentum is weakening faster than price does lend weight to support; however the weakening momentum does suggest that we could be soon looking to enter a corrective phase and fresh market longs need to be cautious here.
Failure to make fresh highs would be technically bearish, and suggest that current support levels could be broken. Any fresh high is technically bullish, however Bull traps (hidden divergences to some) usually result in a bearish divergence, and this is why we believe fresh longs need to be cautious. Note: corrective, not a bear trend as the index remains in bullish territory.
Capesize Q3 v Cal 18
Daily Support – 377, 238, (-47)
Resistance – 1,244, 1,383, 1,637
The technical footprint to the Q3 v Cal 18 futures spread is very similar to that of Cal 18 futures. An aggressive technical pullback has held at key support levels keeping the bullish trend intact. However the momentum pullback has created the hidden divergence/ bull trap that signals a weakening trend, and often end in bearish divergences if fresh highs are achieved. Technically a bull trend, market longs should now be cautious. Failure to make a new high will put current support levels under pressure. Fresh highs should result in a bearish divergence, suggesting a corrective phase could soon be upon us.

Source: Freight Investor Services (FIS)